

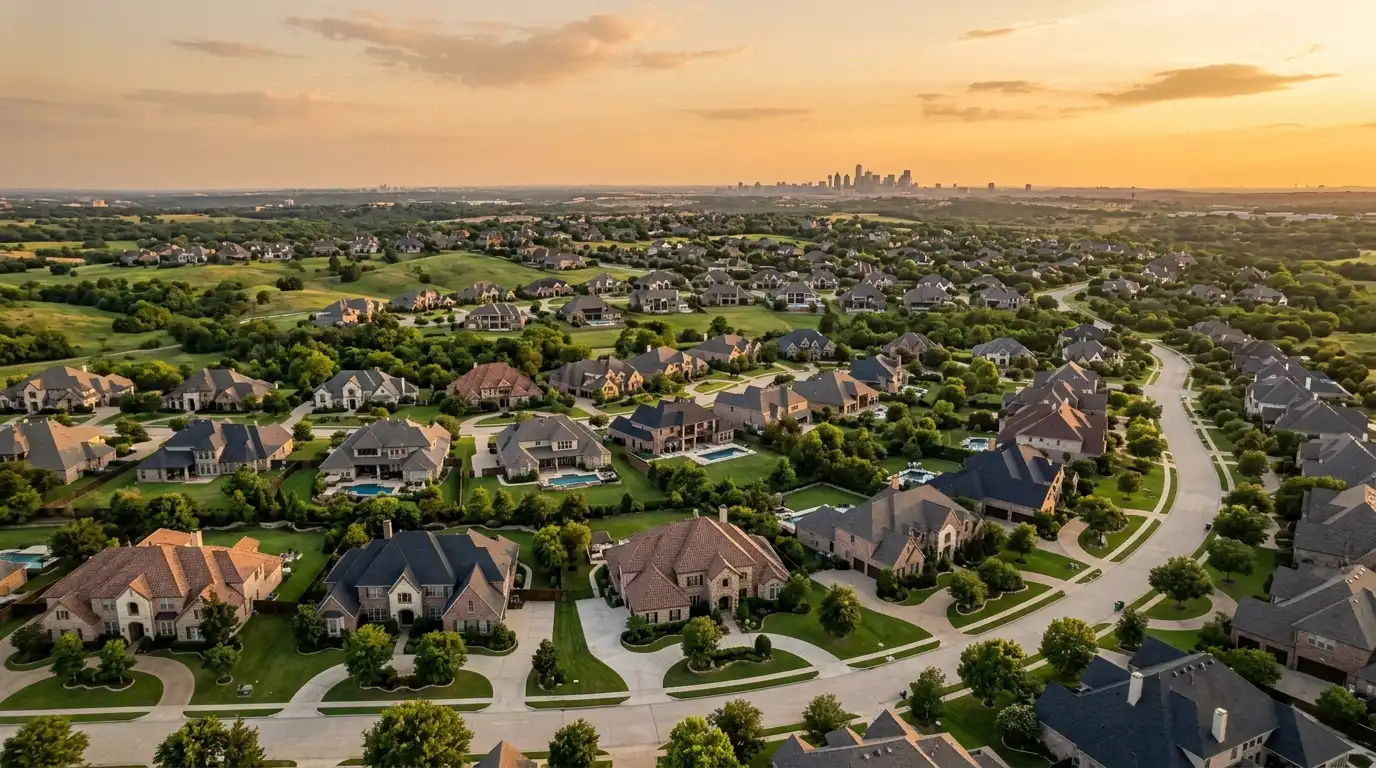
Dallas-Fort Worth is the largest luxury housing market in Texas, and it is not close. Between November 2024 and October 2025 the metro recorded 5,485 sales of homes at one million dollars or more, worth $9,682,347,618. That is 38 percent of every million-dollar home sale in the state.
What follows is the full data picture: how large the market actually is, what a luxury home here physically is, a seasonal pattern most sellers never plan around, and what the figures mean if you are buying or selling. Every number is sourced and dated, and the section on what the data cannot tell you is at the end rather than left out.
Key Figures at a Glance
Dallas-Fort Worth-Arlington MSA, homes sold at $1,000,000 or more, November 2024 to October 2025. Source: Texas REALTORS 2025 Sales of Million-Dollar Homes Report.
- Sales: 5,485, up from 4,989 the previous year, an increase of about 10 percent
- Dollar volume: $9,682,347,618
- Share of all Texas million-dollar sales: 38 percent, the largest of any metro
- Share of all DFW residential dollar volume: 20.8 percent
- Median closing price: $1,421,560 as of October 2025, up 4.3 percent
- Average price per square foot: $402, up $7
- Median size: 4,284 square feet
- Median year built: 2007
- Average days on market: 61, up from 57
- Months of inventory: 6.5, up from 5.6
- New listings in the period: 10,878
- Closing price as a share of original list: 93 percent
How Large the Market Actually Is
The headline number is $9.68 billion across 5,485 transactions. Two things make that figure more interesting than its size alone.
The first is share. Texas as a whole recorded 14,418 million-dollar home sales in the period, a record, generating $24.5 billion. Dallas-Fort Worth accounted for 5,485 of them. Houston recorded 3,948, Austin 2,714 and San Antonio 736, with the remainder spread across the rest of the state.
| Metro | Million-dollar sales | Share of Texas |
|---|---|---|
| Dallas-Fort Worth-Arlington | 5,485 | 38% |
| Houston-Pasadena-The Woodlands | 3,948 | 27% |
| Austin-Round Rock-San Marcos | 2,714 | 19% |
| San Antonio-New Braunfels | 736 | 5% |
| Rest of Texas | 1,535 | 11% |
Austin has spent several years as the Texas market that attracts national attention. On luxury transaction count, Dallas-Fort Worth does more than twice its volume.
The second is concentration within the local market. Million-dollar sales made up 20.8 percent of all residential sales dollar volume in Dallas-Fort Worth. Roughly one in five dollars that moved through residential real estate in this metro moved through the luxury tier, which is a far larger share of the money than of the transactions.
What a Million-Dollar Home in Dallas-Fort Worth Actually Is
This is the part rarely written down, and it is the most useful orientation for anyone entering the market from outside it.
| Measure, October 2025 | Million-dollar homes | All residential homes |
|---|---|---|
| Median size | 4,284 sq ft | 2,096 sq ft |
| Average price per square foot | $402 | $205 |
A luxury home in this metro is roughly twice the size of a typical one and costs roughly twice as much per square foot. Those two multipliers compound, which is the arithmetic reason the luxury tier is a separate market rather than the top of the ordinary one.
The median year built is 2007. That single figure carries a lot of information. It means the centre of gravity of this market is not the pre-war estate but the large, relatively modern house, and it reflects how much of the metro’s luxury inventory sits in the Mid-Cities and northern corridors where that stock was built. The older housing of the Park Cities, Preston Hollow and the established central neighborhoods sits on one side of that median, and the newer construction of Southlake, Westlake, Frisco and Prosper on the other.
The gap between mean and median
Median closing price was $1,421,560. Average sale price across the full period works out to about $1,765,241, a difference of roughly $344,000.
A mean that sits well above the median tells you the distribution has a long upper tail: a relatively small number of very large transactions pulling the average up, above a much denser band of sales closer to the million-dollar threshold. Practically, most of this market transacts nearer $1.4 million than $1.8 million, and the estate tier above it is real but thin.
The Seasonal Pattern Most Sellers Never Plan Around
The monthly transaction counts are the most actionable part of the dataset, and they are rarely published in a form anyone can use.
| Month | $1M+ sales | Month | $1M+ sales |
|---|---|---|---|
| November 2024 | 393 | May 2025 | 565 |
| December 2024 | 430 | June 2025 | 591 |
| January 2025 | 260 | July 2025 | 571 |
| February 2025 | 318 | August 2025 | 506 |
| March 2025 | 465 | September 2025 | 405 |
| April 2025 | 528 | October 2025 | 453 |
June closed 591 luxury sales. January closed 260. That is a swing of roughly 2.3 times between the strongest and weakest months of the same year, in the same market, for the same product.
Concentrate it further and the picture sharpens. The four months from March through June accounted for 2,149 sales, which is 39.2 percent of the entire year compressed into a third of the calendar. The three months from November through January accounted for 1,083, under 20 percent.
What this means in practice
If you are selling, the deepest buyer pool of the year is in spring, and a spring closing means a late-winter listing, which means preparation starts in the new year. Sellers who decide in April that they would like to sell are aiming at the back half of the window rather than the front of it.
If you are buying, the inverse is the opportunity. Competition thins considerably from November through January. Less choice, and less company.
There is a compounding reason behind the spring concentration that is specific to this market. A large share of luxury households here move on a school-year timeline, and independent school admissions decisions in Dallas typically arrive in March, which forces a compressed search and closing before an August start. That mechanism is set out in the Dallas private school admissions calendar and your home search. The seasonal curve above is, in part, that calendar showing up in the transaction data.
Supply, Speed and What They Signal Together
Three figures moved in the same direction, and read individually they look like softening.
- Months of inventory rose from 5.6 to 6.5.
- Average days on market rose from 57 to 61.
- 10,878 new luxury listings entered the market against 5,485 sales.
Read alongside the other two figures, they say something different.
- Sales rose from 4,989 to 5,485, an increase of about 10 percent.
- Median closing price rose 4.3 percent.
A market that is genuinely weakening does not post higher volume and higher prices at the same time. What this combination describes is normalization: more inventory reaching the market, buyers taking longer to choose because they have more to choose from, and the market absorbing that additional supply at a slightly higher price than the year before.
For context, a balanced market is generally considered to sit somewhere around five to six months of supply. At 6.5, the DFW luxury tier is on the buyer-favourable side of balance. That is a meaningfully different condition from the broader metro, where supply has been tighter, and it is why advice written about the DFW market as a whole frequently does not apply at this price point.
The 93 Percent Rule
Closing price averaged 93 percent of original list price.
For a seller this is the single most practical figure in the report, and it is worth stating plainly what it means. Across the market as a whole, initial asking prices were running about 7 percent ahead of what buyers actually paid.
The strategic consequence is not that you should discount. It is that a home priced correctly from day one is competing against a field that is, on average, overpriced. Correct pricing is not a concession in this market, it is a competitive position, and it is available to anyone willing to take a defensible valuation seriously instead of testing a number.
It also frames the cost of getting it wrong. A property that launches above the market and then reduces is not simply arriving at the right number late. It is arriving there having spent the period of highest buyer attention, the first two or three weeks, being ignored.
Where the Metro’s Luxury Inventory Sits
The metro’s luxury stock divides into three broad areas that behave differently. These notes describe housing stock and market mechanics only.
The established core: Preston Hollow, the Park Cities, Bluffview, Lakewood
Older housing, smaller and more variable lots, and the shortest distances to the Dallas core. This is where the land-value dynamic is strongest: on a meaningful number of properties the lot is worth more than the structure, which supports continuous renovation and rebuild activity and makes automated valuation least reliable. Two homes on one street can be worth very different amounts for reasons no model can see.
The Mid-Cities corridor: Southlake, Westlake, Colleyville, Trophy Club, Grapevine
Newer construction on larger lots, much of it built from the 1990s onward, and closer to DFW International Airport than the Dallas core is. This corridor sits nearer the metro’s median year built of 2007 than the established core does.
The northern corridor: Plano, Frisco, Prosper, Celina, McKinney, Allen
The newest stock and the deepest supply, with continuing construction. Because builders can add supply here in a way that a built-out neighborhood cannot, this corridor tends to carry more inventory and behaves more like a market with an elastic supply curve. Municipal utility and public improvement districts are more common in the newer developments, and they change the cost of ownership without changing the list price.
What the Data Means If You Are Buying
You have more room than the headline suggests. At 6.5 months of supply and 61 days on market, this is not a segment where you must decide in a weekend. That is a real change from recent years and it should change how you shop.
The 93 percent figure applies to you as well. If asking prices are running roughly 7 percent ahead of closings, the list price is an opening position rather than a valuation. Know what the property is actually worth before you anchor to what is printed on it.
Consider the calendar. Roughly a fifth of the year’s transactions happen between November and January. Buyers active in that window face materially less competition than those searching in May.
Ask what taxing districts a property sits in before you fall in love with it, particularly in the northern corridor. Two homes at the same price can cost different amounts to own.
What the Data Means If You Are Selling
Price it right at launch. With closings averaging 93 percent of original list, the field you are competing against is mostly overpriced. Accuracy is an advantage rather than a sacrifice.
Work backward from spring. If you want the deepest buyer pool, you are listing in late winter, which means preparation begins around the new year. At this end of the market, getting a home genuinely ready frequently takes three to six weeks before it can be photographed.
Budget realistic time. The 61-day average measures listed days only. From decision to closing, a realistic plan is three to five months.
If you are also buying, settle the sequencing first. With inventory at 6.5 months you have somewhat more room to sell first and buy second than you would in a tight market. The structures are covered in how to buy before you sell in Dallas-Fort Worth.
A Note on Texas Data
Texas is a non-disclosure state. The price a home sold for is not filed in the public record the way it is in most of the country, and there is no public database of what homes actually traded for.
Aggregate figures like the ones in this report come from the multiple listing service and from bodies that compile it, principally Texas REALTORS and the Texas Real Estate Research Center at Texas A&M University. Transactions that occur outside an MLS are not captured at all, which means genuinely private sales, a real feature of the top of this market, sit outside every number on this page.
At the level of an individual property this is also why automated online valuations underperform here, most of all on expensive, individual and land-heavy homes. That is covered in what is my Dallas home worth.
Sources and Methodology
- Million-dollar segment data: Texas REALTORS, 2025 Texas Sales of Million-Dollar Homes Report, covering single-family homes sold at $1,000,000 or more from November 2024 through October 2025, for Texas and its four largest metropolitan statistical areas. Point-in-time measures including median closing price, days on market, months of inventory, price per square foot and median size are stated as of October 2025. Sales counts, dollar volume and new listings cover the full twelve-month period.
- Broader metro context: Texas Real Estate Research Center at Texas A&M University.
- Derived figures: Average sale price of about $1,765,241 is calculated as total dollar volume divided by sales count. The March-to-June share of 39.2 percent and the June-to-January ratio of about 2.3 times are calculated from the published monthly sales series, which sums to the reported annual total of 5,485.
Limitations you should know about
The luxury dataset is annual and lags. It covers November 2024 through October 2025 and is the most recent edition available. It is a benchmark for market structure, not a reading of this month.
Point-in-time figures are October 2025 snapshots. Days on market, months of inventory, median closing price and price per square foot are single-month readings, not twelve-month averages, and monthly figures move.
Metro-wide figures are not neighborhood figures. Nothing on this page describes what is happening on a specific street in Highland Park or a specific pocket of Southlake. The metro average is a starting point for a conversation about a property, not a substitute for one.
Off-market transactions are absent. Sales outside an MLS are not in this data, and at the top of this market that is not a trivial exclusion.
The $1 million threshold is a blunt line. It groups a $1.05 million house with a $6 million estate. The mean-to-median gap is a partial correction for that, but any single figure covering the whole tier is describing a wide range.
What Do These Numbers Mean for Your Property?
Metro data sets context. It does not price a house. Tell us the address and we will build a valuation from actual comparable sales in your specific neighborhood and explain the adjustments.
Request a ValuationFrequently Asked Questions
How big is the Dallas-Fort Worth luxury real estate market?
Dallas-Fort Worth recorded 5,485 sales of homes at $1 million or more between November 2024 and October 2025, totalling $9,682,347,618 in sales volume. That is 38 percent of every million-dollar home sale in Texas, more than any other metro in the state, and it accounted for 20.8 percent of all residential sales dollar volume in Dallas-Fort Worth. Source: Texas REALTORS 2025 Sales of Million-Dollar Homes Report.
What is the median price of a luxury home in Dallas-Fort Worth?
The median closing price for Dallas-Fort Worth homes selling at $1 million or more was $1,421,560 as of October 2025, up 4.3 percent year over year. The average sale price across the full twelve-month period works out to roughly $1,765,241, and the gap of about $344,000 between the two is a signal that a relatively small number of very large transactions sit above a much denser band of sales closer to the $1 million threshold.
What does a million dollars actually buy in Dallas-Fort Worth?
As of October 2025 the median million-dollar-plus home in Dallas-Fort Worth measured 4,284 square feet at an average of $402 per square foot, with a median year built of 2007. For comparison, the median across all residential homes in the metro was 2,096 square feet at $205 per square foot. So a luxury home here is roughly twice the size and roughly twice the price per square foot of a typical metro home. The luxury tier is not a modest step up, it is a different product.
Is the Dallas-Fort Worth luxury market slowing down?
It is normalizing rather than weakening, and the distinction matters. Sales rose about 10 percent year over year, from 4,989 to 5,485, and the median closing price rose 4.3 percent. At the same time months of inventory increased from 5.6 to 6.5 and average days on market went from 57 to 61. More supply and slower velocity alongside higher prices and higher volume is the signature of a market absorbing inventory at a sustainable pace, not one losing demand.
When is the best time to sell a luxury home in Dallas-Fort Worth?
The transaction data shows a pronounced seasonal pattern. June was the strongest month with 591 million-dollar sales and January the weakest with 260, a swing of about 2.3 times. The four months from March through June accounted for 2,149 sales, or 39.2 percent of the entire year in a third of its calendar. Sellers who want to reach the deepest buyer pool are working toward a spring listing, which means preparation begins in winter.
How long do luxury homes take to sell in Dallas-Fort Worth?
Average days on market for million-dollar-plus homes was 61 as of October 2025, up from 57 the previous year. That figure measures listed days and does not include the preparation period before a home reaches the market, which at this end can add three to six weeks on its own. Plan a realistic timeline from decision to closing rather than from listing to closing.
How much do luxury homes sell for compared to asking price in Dallas-Fort Worth?
Closing price averaged 93 percent of original list price as of October 2025. That is the most practically useful number in the dataset for a seller. It says that across the market as a whole, initial asking prices were running roughly 7 percent ahead of what buyers actually paid. A home priced correctly at the outset is competing against a field that is, on average, overpriced, which is a considerable advantage.
How much inventory is there in the Dallas-Fort Worth luxury market?
Months of inventory in the million-dollar-plus segment stood at 6.5 as of October 2025, up from 5.6 a year earlier, with 10,878 new luxury listings entering the market across the twelve-month period against 5,485 sales. A balanced market is generally considered to be around five to six months of supply, so the luxury tier is sitting slightly on the buyer-favourable side of balance, which is a different condition from the broader metro.
How does Dallas-Fort Worth compare to Austin and Houston for luxury sales?
Dallas-Fort Worth leads Texas by a clear margin. Across November 2024 to October 2025 the metro recorded 5,485 million-dollar sales, against 3,948 in Houston, 2,714 in Austin and 736 in San Antonio. That is 38 percent of the state total for Dallas-Fort Worth, 27 percent for Houston, 19 percent for Austin and 5 percent for San Antonio, with the remaining 11 percent spread across the rest of Texas.
Are luxury home prices in Dallas-Fort Worth going up or down?
Up, modestly, in the million-dollar-plus segment. The median closing price rose 4.3 percent year over year to $1,421,560 as of October 2025, and average price per square foot rose by $7 to $402. Those are single-digit gains rather than the sharp movements of the pandemic period, which is consistent with a market that has returned to more ordinary behaviour.
Why is it harder to find accurate home price data in Texas?
Texas is a non-disclosure state, which means the price a home actually sold for is not filed in the public record as it is in most of the country. Aggregate market data comes from the multiple listing service and from bodies such as Texas REALTORS and the Texas Real Estate Research Center, and transactions occurring outside an MLS are not captured at all. For an individual property this is why automated online valuations are weaker here than buyers expect, particularly on higher-priced and less uniform homes.
What percentage of Texas million-dollar home sales are in Dallas-Fort Worth?
38 percent. Dallas-Fort Worth recorded 5,485 of the 14,418 million-dollar home sales in Texas between November 2024 and October 2025. Statewide those sales generated a record $24.5 billion and represented 4.3 percent of all homes sold in Texas, with 89.4 percent of them concentrated in the four largest metros.